Why Order Flow Delta Is the Edge Most Traders Ignore
Price tells you what happened. Delta tells you who did it — and whether they're winning or losing. Understanding the difference between these two is the gap between guessing and knowing.
The Problem With Price-Only Analysis
Most traders watch price, add a few indicators derived from price (moving averages, RSI, MACD), and then wonder why their signals lag. The reason is simple: every traditional indicator is a transformation of the same underlying data — price and time. You're looking at the same information through different lenses, but it's still just one dimension.
Delta — the difference between buying and selling volume at the bid/ask — adds a second dimension. It reveals intent. A large green candle with negative delta tells a completely different story than the same candle with positive delta. One is being sold into strength; the other has genuine aggressive buying behind it.
Six Patterns That Matter
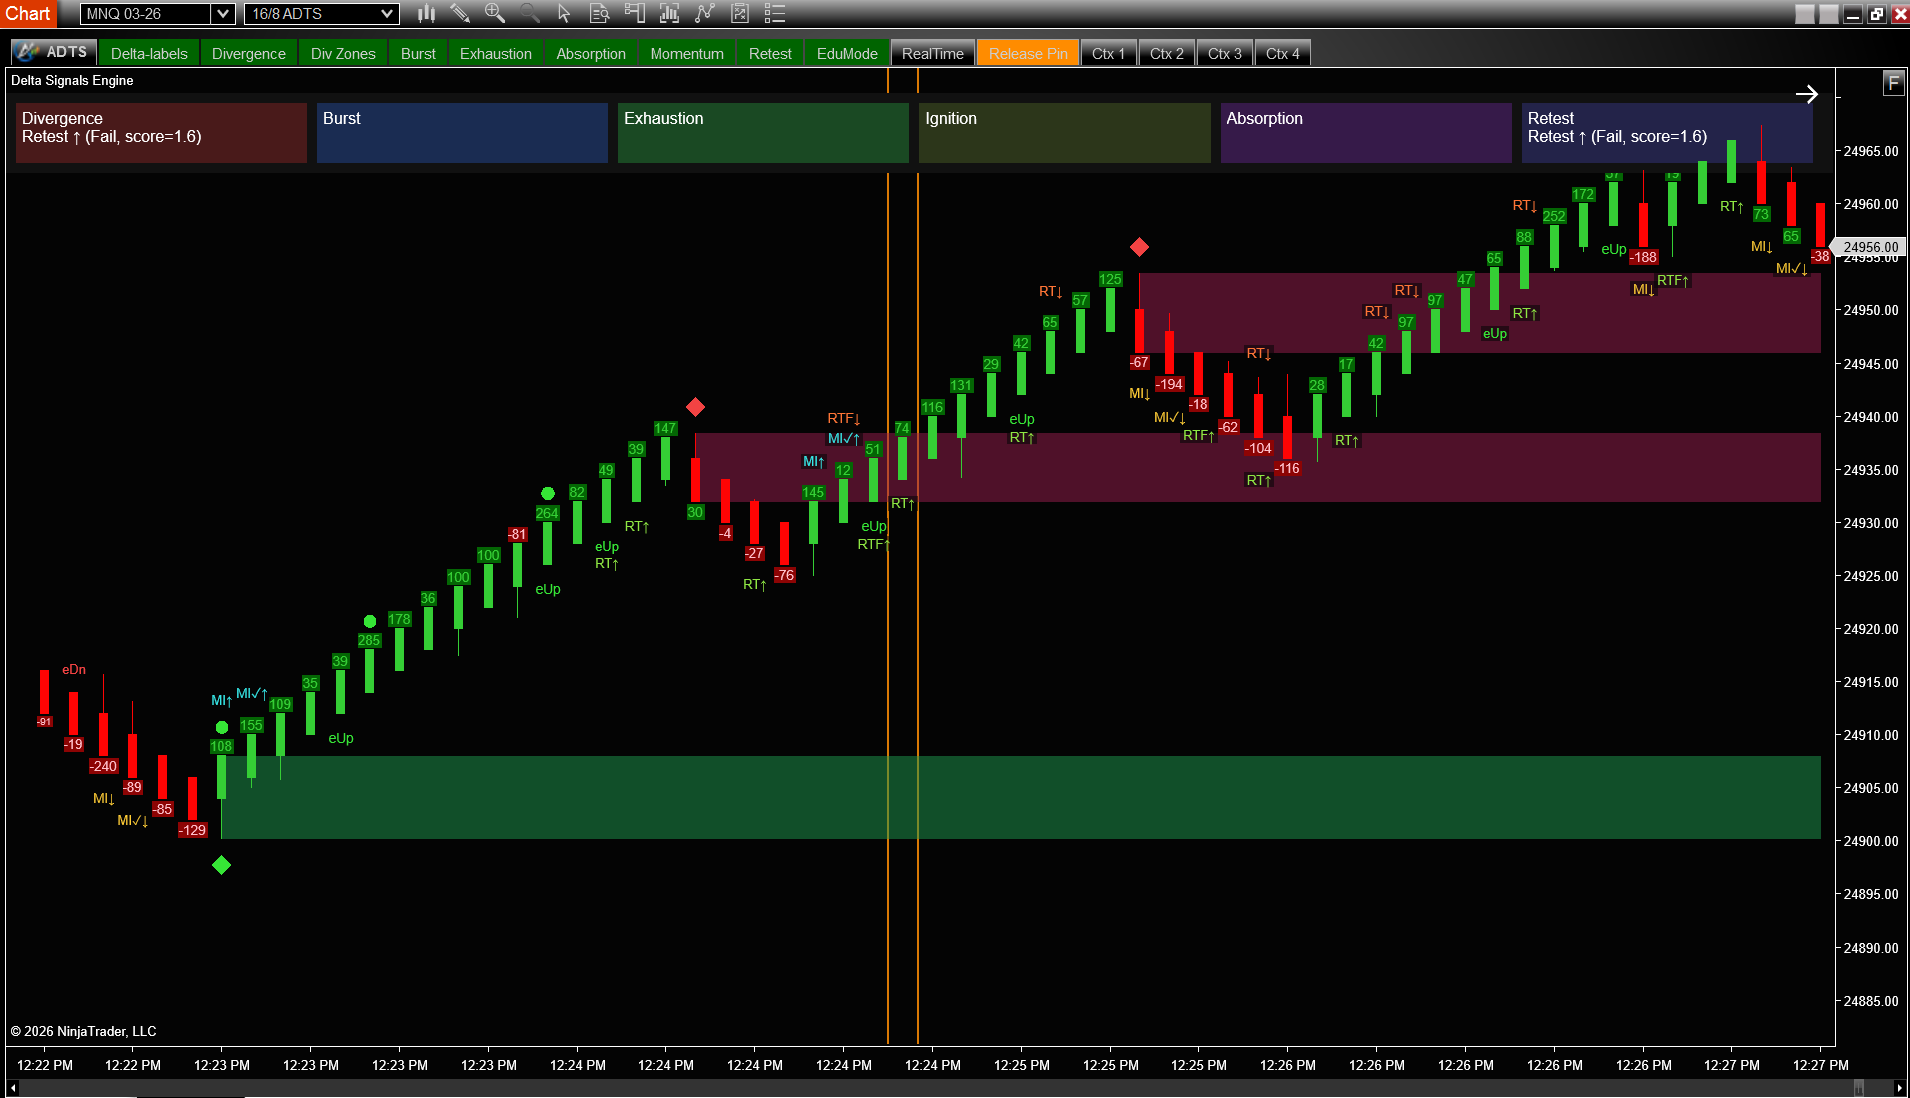
After years of studying order flow, certain delta patterns emerge over and over as high-probability turning points and continuation signals. The Delta Signals Engine codifies six of these into automated detection algorithms, each running independently and each tunable to your market and timeframe.
Delta Burst
Statistically extreme delta on a single bar. When aggressive participation spikes 2.5 standard deviations above normal, something institutional is happening. Bursts often precede continuation moves or mark climactic exhaustion.
Divergence
Price makes a new high but delta doesn't confirm it. This is the classic "hidden hand" pattern — institutions are quietly distributing while retail chases the breakout. Divergence zones mark the exact pivot levels for S/R.
Exhaustion
An effort bar pushes hard in one direction, but subsequent bars fail to extend. The aggressor threw their best punch and the market absorbed it. This effort-to-result failure is one of the most reliable reversal setups.
Momentum Ignition
A displacement bar breaks through the recent range with extreme conviction — range exceeds 1.6× ATR, close in the outer quartile, backed by strong delta. These bars often mark the start of a new leg.
Absorption / Trap
Heavy delta commitment with no price follow-through. Buyers pushed hard but the bar closed near its low — they're trapped. The reversal that follows often catches an entire group of participants on the wrong side.
Zone Retest
Price returns to a previously identified divergence zone. If the level holds (close rejects back out), it validates the zone as genuine support or resistance — not just a one-off price reaction.
Confirmation, Not Prediction
This is the critical point that separates profitable delta analysis from another form of indicator-chasing: DSE is designed as a confirmation layer, not a standalone system.
Your existing trading system gives you entries — whether that's a moving average crossover, an Ichimoku cloud breakout, a trendline bounce, or a supply/demand zone tap. What DSE adds is the "why should I trust this signal?" layer. When your system says "buy" and DSE shows a bullish burst + zone retest holding support, you have conviction. When your system says "buy" but DSE shows bearish absorption and exhaustion, you wait.
"The market doesn't care about your indicators. It cares about order flow. Everything else is a derivative."
The Educational Advantage
One of the hardest parts of learning order flow is understanding why a pattern matters. Most tools show you dots and lines with no explanation. DSE's Educational Mode changes this fundamentally.
Hover over any signal bar and a detailed strip appears showing exactly what was detected: the Z-score that triggered a burst, the delta drop ratio that confirmed exhaustion, the TR fraction that flagged absorption. Every number is visible. Every condition is explained. You're not just seeing signals — you're learning to read the tape.
In real-time Interactive Mode, DSE automatically pops these explanations as signals fire live. Over weeks of trading, this builds genuine pattern recognition that eventually becomes intuitive. The goal isn't to depend on the indicator forever — it's to train your eyes to see what the indicator sees.
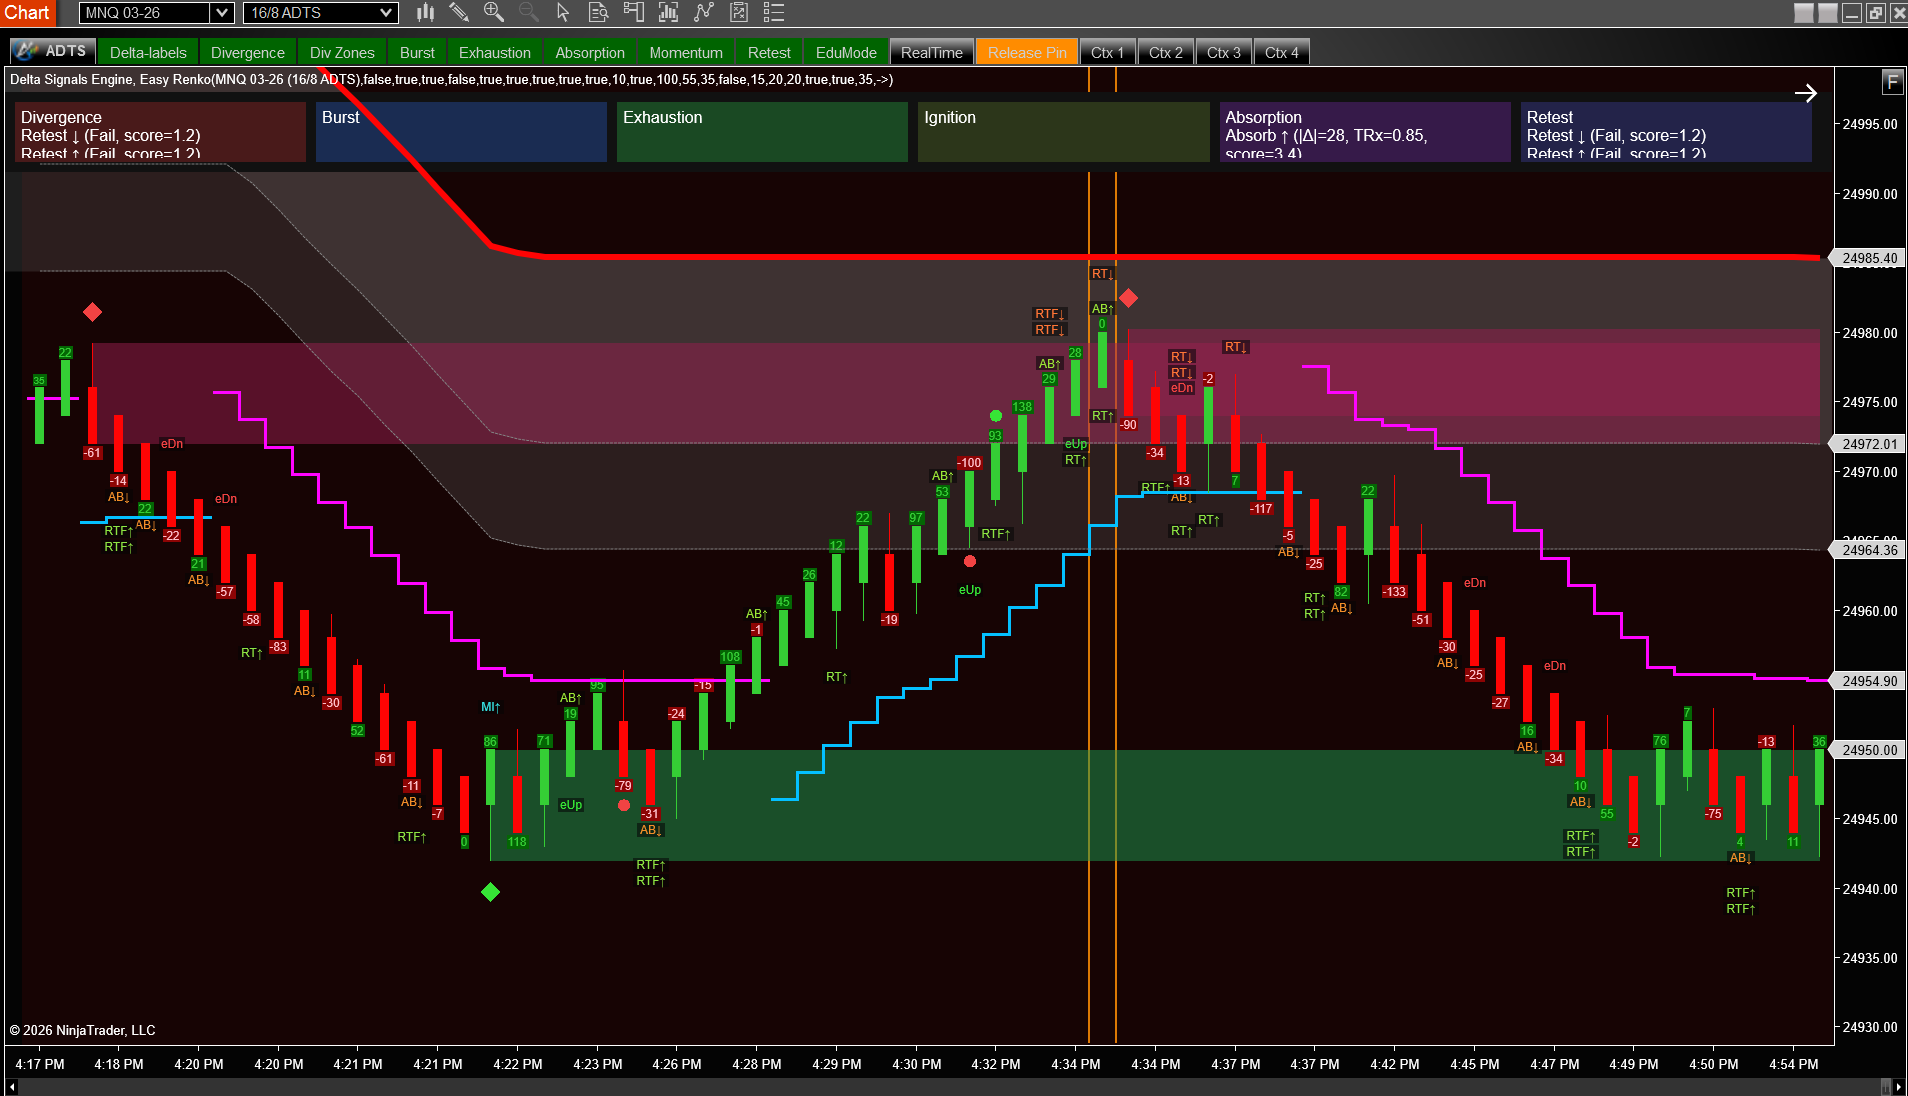
Pairing DSE With Easy Renko
While DSE works on any chart type, it shines particularly well on Renko charts. The reason is noise reduction: Renko bars filter out time-based noise and present only price movement, which makes delta signals cleaner and more actionable.
With Easy Renko (ERTS), you get the added benefit of configurable brick sizing that can be calibrated to your instrument's volatility. A 4-tick Renko on NQ with DSE overlay produces remarkably clean signals — bursts are more visible, divergence zones are cleaner, and absorption traps are easier to spot because the noise floor is lower.
Strategy Automation
For systematic traders, every DSE engine exports NinjaScript Series that can be consumed by any strategy. BurstSignal, DivergenceSignal, ExhaustionSignal, IgnitionSingleSignal, IgnitionTwoStepSignal, AbsorptionSignal, and ZoneRetestSignal — all output +1, −1, or 0 with accompanying score and bar index series.
This means you can build a fully automated strategy that uses DSE signals as entry filters, confluence requirements, or standalone triggers. Combine a burst + divergence zone retest for high-conviction entries, or use absorption as a take-profit signal when your existing position encounters a trap bar.
BurstSignal[0] == +1 or ZoneRetestSignal[0] == +1. This single filter can dramatically reduce false entries by requiring order flow confirmation.
What Makes This Different
There are other delta tools on the market. Most of them show you cumulative delta as a separate panel or a footprint chart. Those are useful but they require you to interpret the data. DSE takes a fundamentally different approach:
It runs six independent statistical detection algorithms in real-time, renders the results as clean, unambiguous labels directly on price, and explains every signal with educational context. You don't need to stare at a footprint and try to figure out what's happening. DSE tells you: "This is absorption. Here's the Z-score. Here's the score. This is what it means."
And because it's an overlay — not a panel — it works alongside anything else on your chart. Your VWAP, your EMAs, your supply/demand zones, your Ichimoku cloud — DSE sits on top and adds the order flow dimension that none of those tools provide.
Ready to See What's Behind the Bars?
$499 lifetime license. Six signal engines. Educational mode built in. Works with any trading system.
Get Delta Signals Engine — $499